AppliMarkets: Your Go-To Resource for App Insights
Explore the latest trends, reviews, and tips in mobile applications.
Data Visualization Software That Makes You Look Like a Genius
Unlock your inner genius with the best data visualization software! Create stunning visuals that impress and simplify complex data at a glance.
10 Data Visualization Tools That Will Elevate Your Presentations
When it comes to enhancing your presentations, data visualization tools play a crucial role in making complex information more digestible. Here are 10 data visualization tools that can significantly elevate your presentations:
- Tableau: A powerful tool that allows you to create stunning visualizations and dashboards easily.
- Qlik: Provides interactive dashboards and customizable visualizations.
- Microsoft Excel: Traditionally a spreadsheet tool, it also offers great data visualization features.
- D3.js: A JavaScript library that helps you create dynamic and interactive data visualizations in web browsers.
- Power BI: Microsoft’s business analytics tool that provides interactive visualizations with self-service business intelligence capabilities.
- Infogram: An intuitive platform for creating infographics and reports in a short span of time.
- Canva: Known for its design capabilities, Canva also allows users to create visually appealing charts and graphics.
- Google Charts: A versatile tool that’s free to use and integrates easily with other Google services.
- ChartBlocks: Simplifies the process of making charts and provides a straightforward interface.
- MindMeister: Great for creating mind maps and visual brainstorming sessions.
Leveraging these data visualization tools not only enhances the aesthetic appeal of your presentations but also helps in clearly conveying your message. Investing time in learning these tools can lead to more engaging and informative presentation experiences for your audience. Remember, the right visualization can make all the difference in how your data is interpreted, so choose wisely and practice often to master these essential tools!

How to Choose the Right Data Visualization Software for Your Needs
Choosing the right data visualization software can significantly enhance your ability to interpret and present complex information effectively. First, consider your specific needs: what type of data are you working with? Is it time-series data, hierarchical data, or perhaps geospatial data? Understanding your data will help you determine the features you need in a tool. For instance, if you're working with geographic data, you might want to explore software that specializes in geospatial data visualization. Additionally, evaluate the user interface; a user-friendly platform can save time and ease the learning curve.
Next, think about your budget and scalability. Some software options are free or have a low-cost tier, while others can be quite expensive. It's essential to balance your budget with the features you require. Also, consider whether the software can grow with your needs. Will it accommodate larger datasets or more complex visualizations as your projects evolve? To make an informed decision, read Gartner's reviews of various data visualization software. This research will help you find a solution that not only fits your current requirements but also adapts to future demands.
The Impact of Data Visualization on Decision-Making: Why You Can't Afford to Ignore It
Data visualization has become a crucial element in decision-making processes across various industries. By transforming complex data sets into visually intuitive formats, organizations can quickly identify trends, patterns, and anomalies that may otherwise go unnoticed. A strong emphasis on data visualization not only enhances comprehension but also improves the speed of insights. According to a Forbes article, effective visualization can increase retention rates up to 400%. This means that engaging graphics can significantly influence a team's ability to make informed decisions swiftly and confidently.
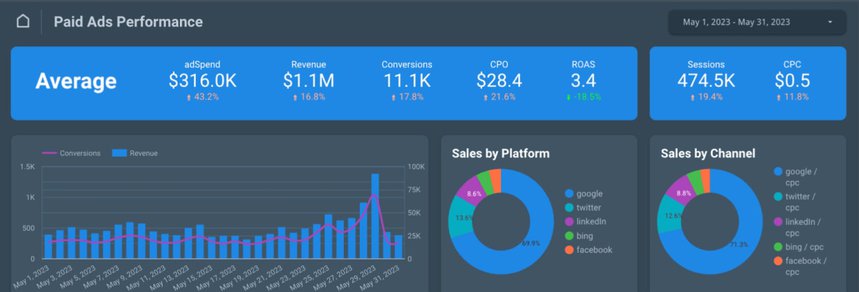
Moreover, the impact of data visualization extends to fostering collaboration among stakeholders. When data is presented clearly, it becomes easier for teams to discuss, analyze, and formulate strategies based on shared insights. For instance, platforms like Tableau and Microsoft Power BI enable users to create interactive dashboards that facilitate discussions around data-driven decisions. Ignoring the importance of data visualization can lead to missed opportunities and poor outcomes, making it imperative for organizations to invest in this powerful tool to stay competitive in today's data-driven landscape.